Unlock the Editor’s Digest for free
Roula Khalaf, Editor of the FT, selects her favourite stories in this weekly newsletter.
This article is an on-site version of Martin Sandbu’s Free Lunch newsletter. Sign up here to get the newsletter sent straight to your inbox every Thursday
I’m Tej Parikh, the FT’s economics leader writer, and I am standing in for Martin Sandbu, who is away this week. With another splash of “hot” economic data, belief in America’s “strong” economy is only getting stronger. I play contrarian.
Everyone loves a good story. Narratives help us connect what we observe to a bigger picture that we can make sense of. Economists and investors make stories all the time. The story of the “strong” US economy has not gone away. The S&P 500 hit a new record last week, in part down to the rosy economic outlook. The US bull-bear spread (or positive minus negative beliefs) in the latest AAII Sentiment Survey is at “an unusually high level” and above its historical average.
The positivity is backed by headline data: US economic growth has surpassed most forecasters’ expectations, despite high interest rates and inflation. Unemployment is near record lows, and consumers have been spending freely.
But our bias towards neat narratives can also cause us to underweight discrepancies that do not fit into our world view and blind us to turning points. I sense many US watchers are extrapolating the resilience of 2023 into this year. They could be right, but playing devil’s advocate is always a useful exercise to ward off confirmation bias.
So, for my first guest Free Lunch, I thought I would take on a dominant global economic narrative, and deliberately take the contrarian view. Here it goes, the bearish case for the American economy:
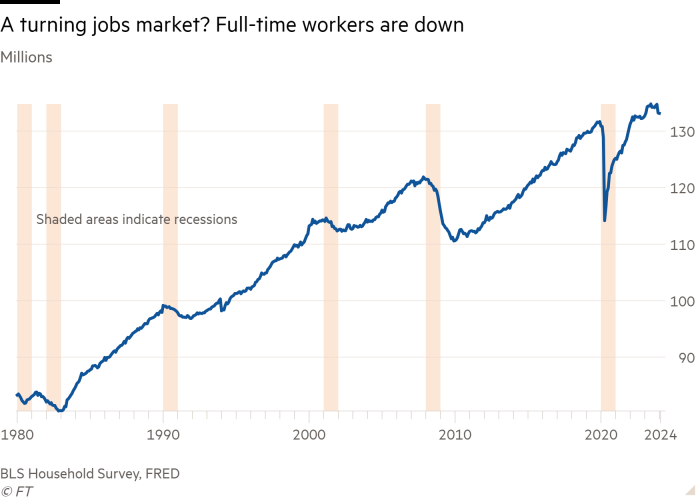
First to those “stunning” job numbers. The Bureau of Labor Statistics’ total payrolls number for January was undeniably strong. But focusing on the “blowout” headline figure detracts from a more nuanced story. Full-time employment has actually been flat since the summer, and it fell last month. A rise in part-time work and individuals with multiple jobs may be propping up the overall numbers. The BLS’s household survey, which excludes multiple jobholders, points to a cooling labour market. Even if one chooses to ignore that: in a research note Goldman Sachs said it would “heavily discount” the total 353,000 gain in January payrolls as seasonal adjustment factors were likely to be overinflating it.

Either way, yes, a lot of Americans have jobs. But that is not necessarily a sure-fire signal of a strong economy. What matters is the nature of those jobs — and which way the market is headed. In December, close to 40 per cent of those surveyed by Harris Poll said their households had relied on additional incomes — such as from multiple jobs — to make ends meet. A significant portion of those barely managed to cover their monthly expenses. A YouGov poll also shows that more than 40 per cent of registered US voters are worried about their job security.
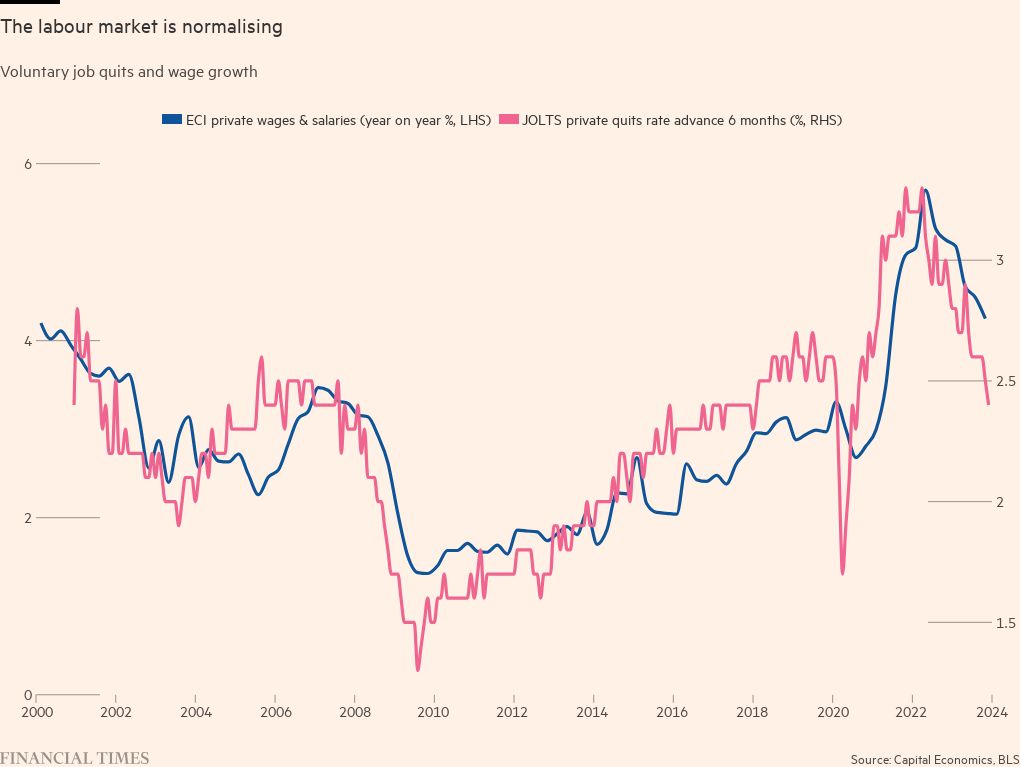
Next, look at pay. The Atlanta Fed’s Wage Growth Tracker has been on a downward trend since last March. That looks likely to continue. The NFIB’s employment intention index — a measure of future hiring activity — and the jobs quit rate are falling fast. That matters as both have been remarkably well correlated with private payrolls. Real wages may be rising in aggregate, but not all jobs and geographies are uniform — many are still, and will remain, worse off from the recent inflationary period.
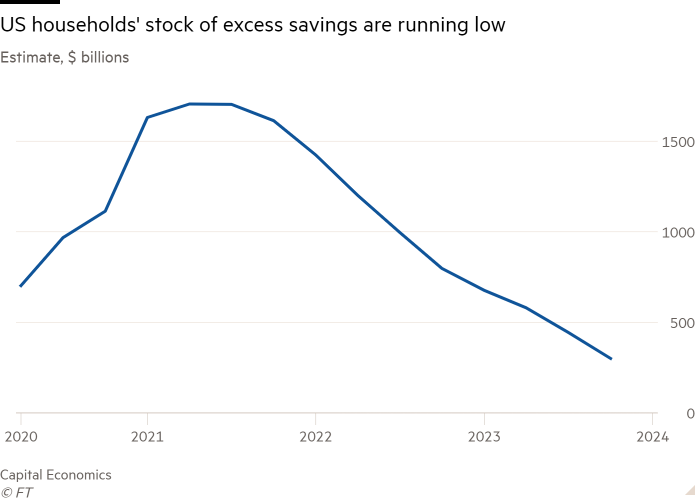
Right, so that should at least cast some doubt on the momentum in the US jobs market. Now for consumer spending. It was surprisingly strong last year. But it had rocket boosters underneath it in the form of pandemic savings — and government support. Those are now close to depletion, according to estimates from Capital Economics. So, the resilience of the American consumer will now be increasingly tested. Indeed, credit card and auto loan transitions into delinquency are still rising above pre-pandemic levels. And average mortgage rates are still near 7 per cent; close to a two-decade high.

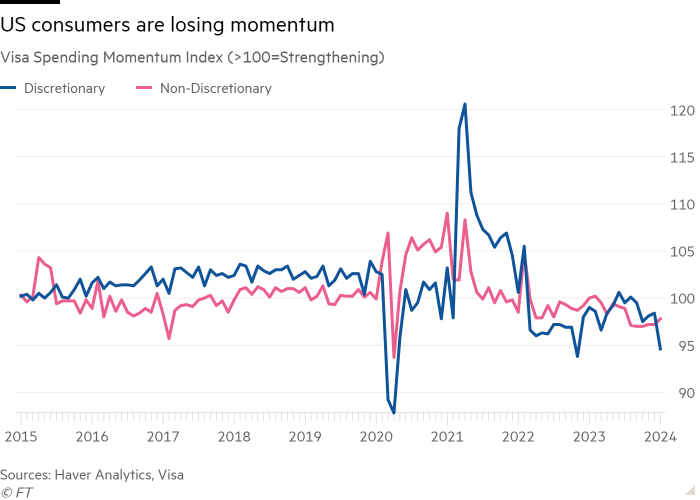
The upshot? The American consumer is losing momentum. Visa’s Spending Momentum Index, which draws upon the company’s card usage data, picks up sales at physical stores, purchases of services and the use of digital commerce (which headline measures omit). It suggests fewer consumers are spending more, relative to the previous year, for both discretionary and non-discretionary items. Elsewhere, airline passenger numbers are trending down, as is hotel occupancy and the number of restaurant diners according to OpenTable.
So, just this cursory contrarian glance at US households should help assuage some of the confusion about why a “solid” jobs market and falling inflation are doing little to improve Americans’ faith in President Joe Biden’s handling of the economy. The latest FT-Michigan Ross poll says as much.

Now for US businesses. Higher interest rates are increasingly having an impact. Last year’s boom in Chips Act-related capital expenditure is easing off, as are investment intentions. Bank lending standards remain tight. The read across from the record-breaking stock market to the real economy is even more unreliable than usual. The “Magnificent Seven” tech stocks — fuelled by optimism about artificial intelligence — have driven the rise of the S&P 500. But the equal-weighted version of the index remains below the all-time high it set in early 2021. The Russell 2000 index of smaller companies is about 20 per cent below its 2021 peak.
You might still cling to the stellar 3.3 per cent annualised growth rate last quarter. But even there there are questions. A gap has opened up between gross domestic product — a measure of all expenditure in the economy — and gross domestic income, which totals all earnings. In theory, both should match. But because they are collected from different sources, they can differ. GDI has sometimes offered a more accurate picture of true economic conditions. No measure is perfect, but this alternative suggests US growth is perhaps not as far above potential growth as GDP implies. Revisions are always possible.
So even before factoring in the November presidential election, and what the outcome might mean for the US’s economic trajectory, there may be reason to doubt America’s ongoing resilience. Convinced? Send me your thoughts at tej.parikh@ft.com or @tejparikh90 on X.
For what it’s worth, over the course of writing this column, I do think US strength is easing and many temporary factors that propped up activity last year — such as savings (partly from government support), deficit spending, Chips Act expenditure and even the Federal Reserve’s bank term funding programme (which in effect gave the banking system free money) — are either easing or coming to an end. It is debatable whether those interventions constitute underlying resilience, but high rates will now certainly test the economy. How it all plays out will depend, in part, on the Fed’s moves.
The bigger picture is that digging under the headlines, disaggregating totals, focusing on the trend (and not the past), looking at alternate data sets and actually finding out what is behind the numbers is an important test of the veracity of the stories we tell ourselves. Sometimes it can be an eye-opener.
Other readables
-
The competition between Singapore-based Shein and China’s Temu to sell fast fashion and cheap household items to westerners is heating up. Who thought just-in-time supply chains were dead?
-
The FT’s Unhedged has a typically sober piece calling for calm over this week’s hotter than expected US CPI data. Hint: go beyond the headline.
-
Climate change is transforming global insurance. The Big Read series on “the uninsurable world” explores the cost of protection against extreme and frequent weather events, beginning with consumers.
Numbers news
-
The Bank of England’s Bank Underground blog has a nerdy statistical piece that explores a wage growth measure that is reweighted to better match inflation.
-
UK inflation holds firm at 4 per cent in January. Forecasters had expected higher.


