Here’s what the different on-chain indicators from Santiment have to say about whether Pepe Coin could see another pump soon or not.
The Memecoin’s On-Chain Metrics Have Been Down Since The Top
PEPE has been one of the hottest topics around the cryptocurrency market recently, thanks to the explosive growth that the meme coin has enjoyed. Between the end of last month and the 5th of May, the coin saw its price rise by an extraordinary 1,200%.
The uptrend, however, ended there and the cryptocurrency has been sharply plunging since then. According to Santiment, the on-chain analytics firm’s “social dominance” indicator signaled this top in advance.
Social dominance tells us what percentage of the discussions happening on social media related to the top 100 cryptocurrencies by market cap are talking about a given coin.
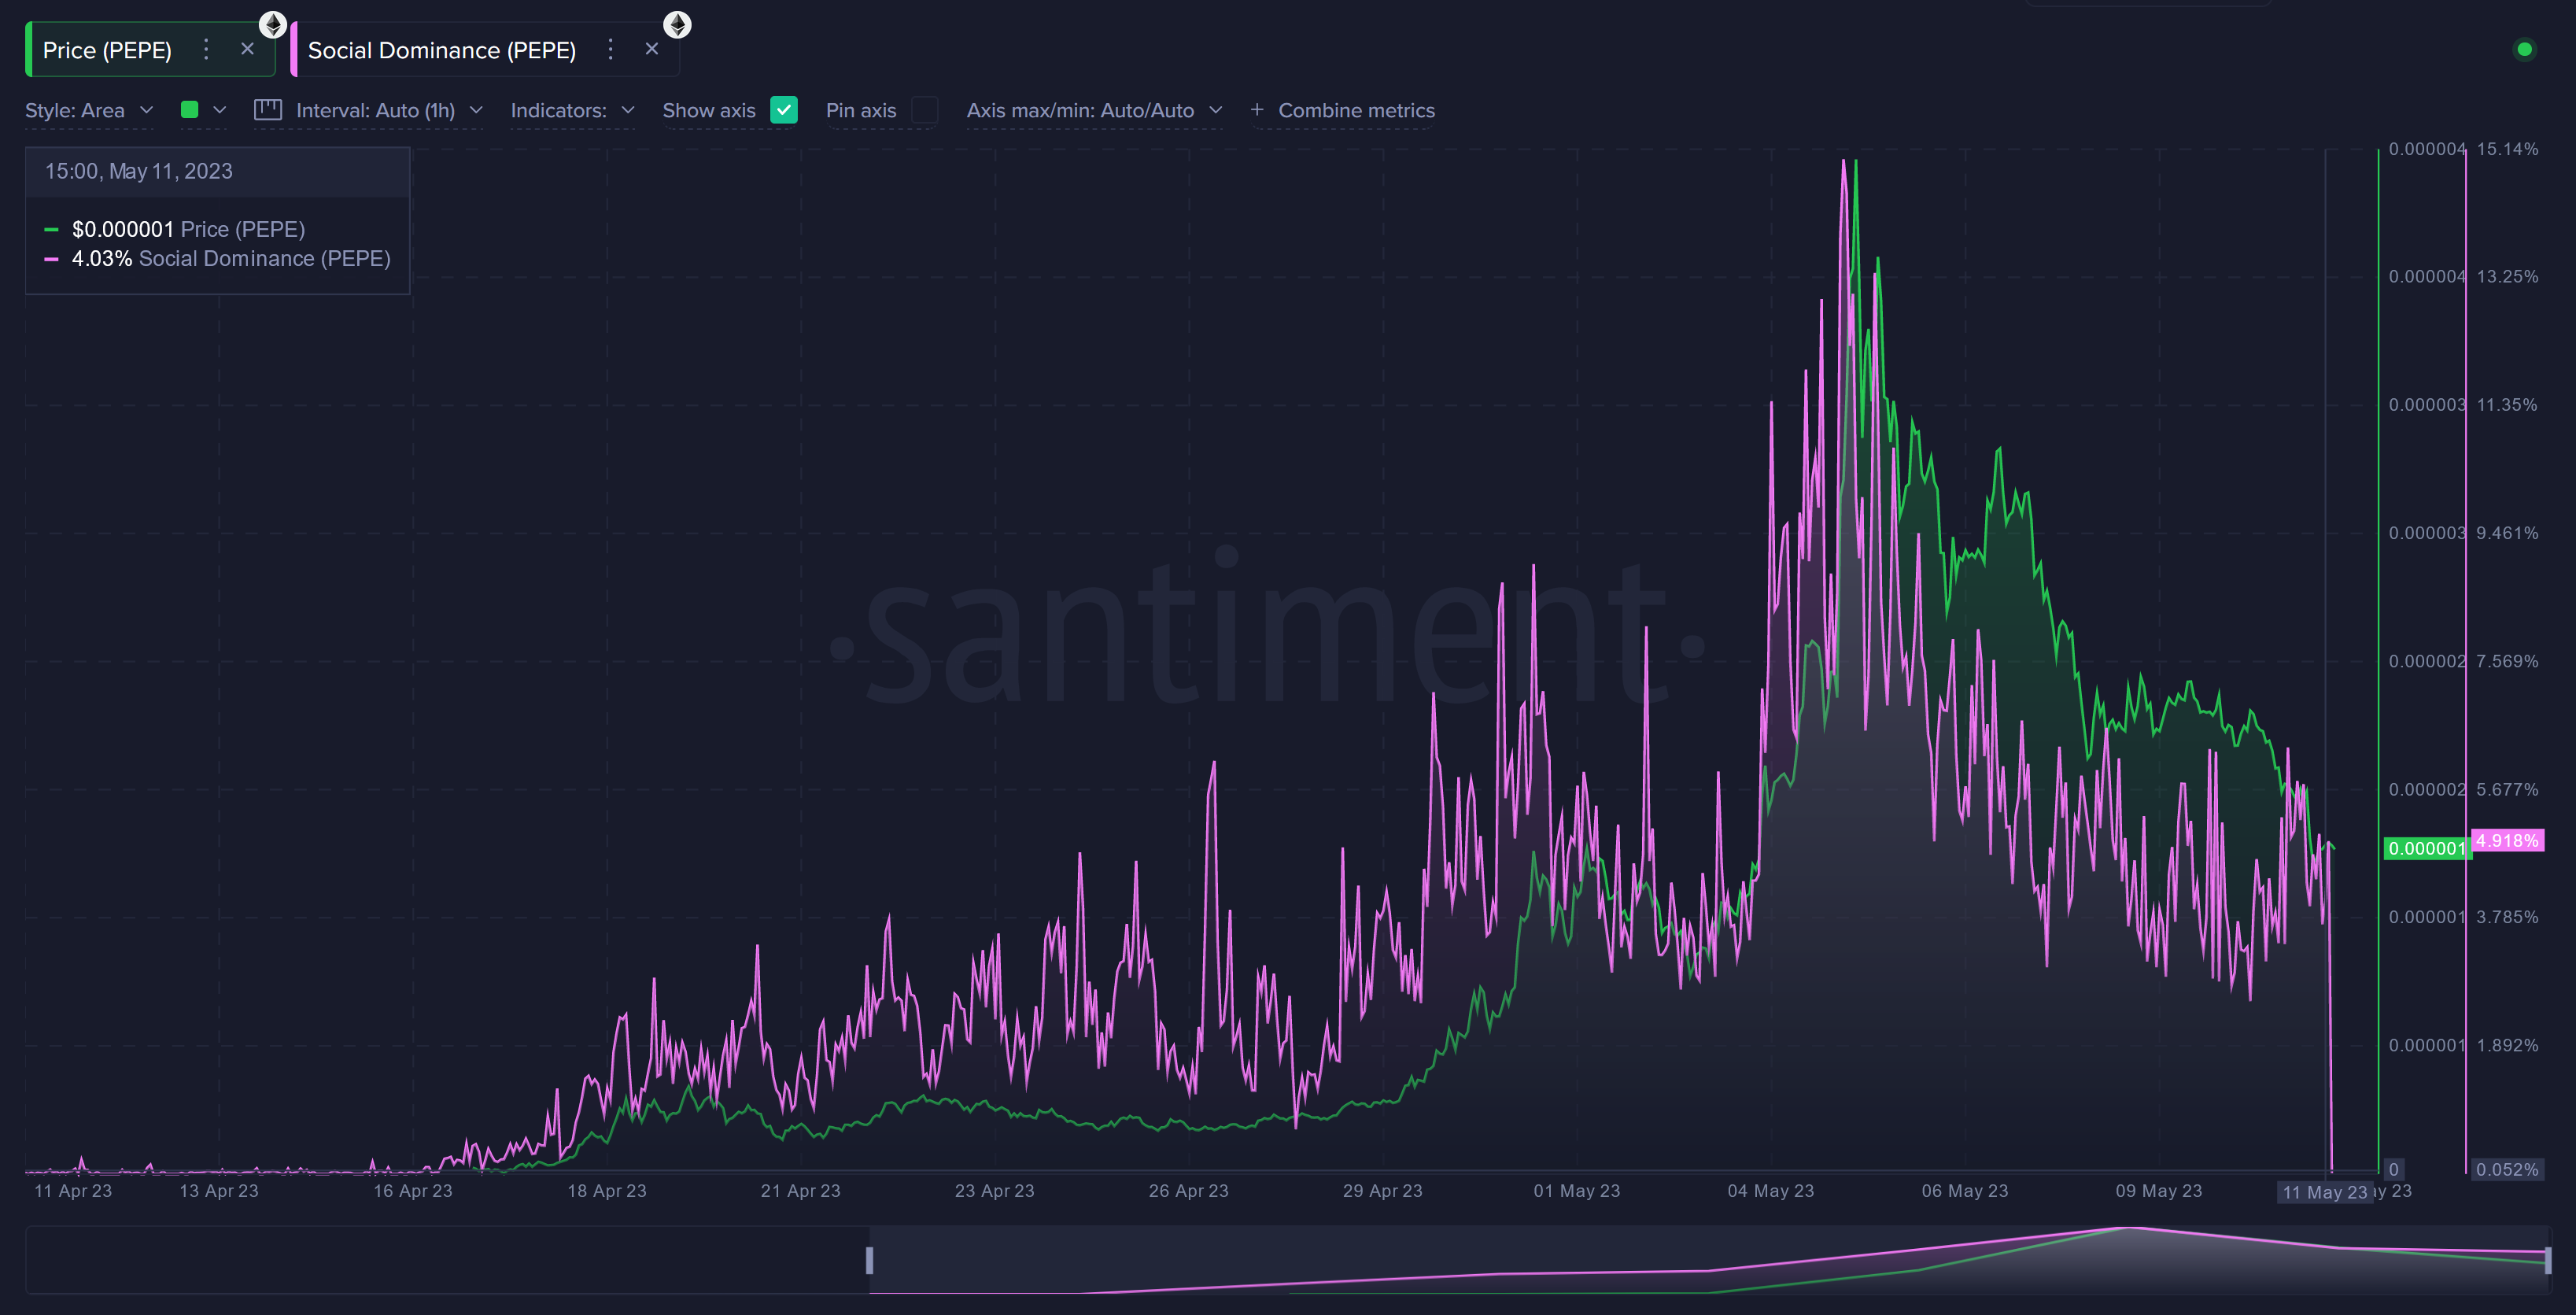
As the below chart shows, Pepe’s social dominance rose to very high values just before the top took form earlier in the month.
Looks like the value of the metric has come down in recent days | Source: Santiment
Whenever social dominance hits high levels, it’s a sign of euphoria among investors, which is something that has historically led to top formations for cryptocurrencies.
Santiment notes that the indicator still has a value of about 5%, meaning that 5% of all discussions related to the top 100 assets involve the meme coin currently.
“Seeing it get down to the 1-2% range would be a good sign that traders are beginning to stray away and look for pumps from other altcoins,” the firm explains.
The active addresses metric, which measures the total number of unique addresses taking part in some transaction activity on the blockchain, also saw a spike just before the top.
The metric seems to have calmed down | Source: Santiment
When this indicator has a high value, it means a large number of investors are making trades right now. The price generally becomes more likely to get volatile when the metric shows such a trend.
From the chart, it’s visible that the active addresses indicator has come down in value for PEPE in the last few days, which means that the market activity has calmed down.
An interesting trend is also visible in the data for the supply of the largest Pepe Coin holders, as the below graph displays.
The holdings of the memecoin's whales | Source: Santiment
These humongous holders had been accumulating while the rally had been going on, but right as the top took form, they started shedding coins from their wallets.
This cohort has continued to sell since then as PEPE’s value has gone downhill. “If you start seeing these lines moving up again, there is a much larger probability of PEPE going for its 2nd round of pumping (though probably a more minor one),” explains Santiment.
One positive sign for the asset, however, may be that the trading volume has rebounded recently after having declined since the top (just like the other metrics).
The trading volume of the asset | Source: Santiment
“All in all, meme coins have to be taken for what they are. They’re controlled by speculation and crowd expectations,” says the analytics firm. “In these fresh, new assets that fit this description, you’ll likely want to watch when the crowd gets too emphatic that one price direction is going to happen.”
PEPE Price
At the time of writing, Pepe Coin is trading around $0.000001251, down 37% in the last week.
The asset continues to decline | Source: PEPEUSD on TradingView
Featured image from iStock.com, charts from TradingView.com, Santiment.net


