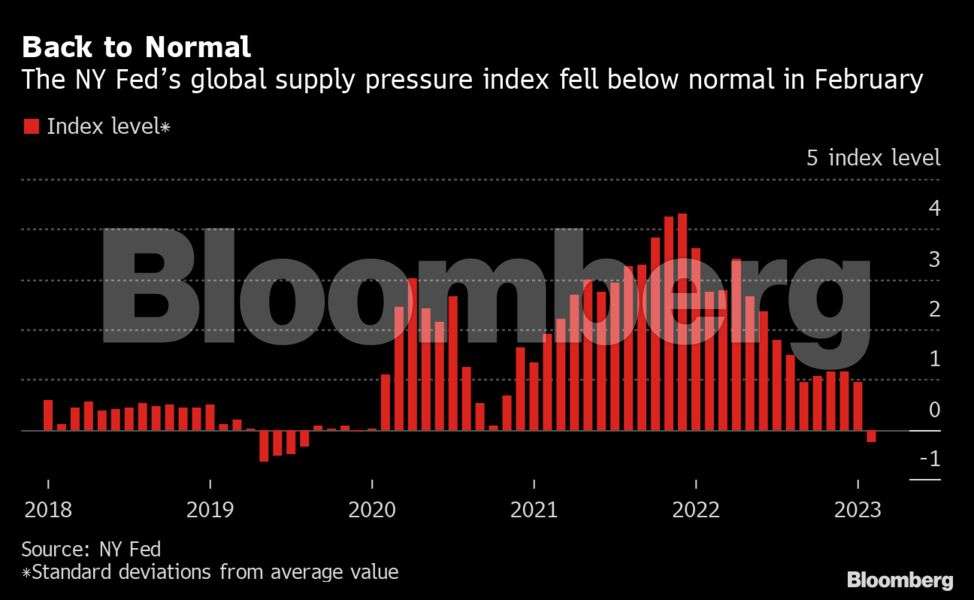
Actually, supply pressures around the world fell below normal. The February reading in the NY Fed’s Global Supply Chain Pressure Index was -0.26, reaching negative territory for the first time since August 2019.
 Bloomberg
Zero marks the historical average, and changes in either direction mark standard deviations from that trend. Maximum disruptions pushed the gauge to a peak of 4.31 in December 2021.Less shipping congestion, an easing of parts shortages and weaker consumer demand have pulled the indicator lower in seven of the past 10 months, and the latest figure reflected more improvement.
“There were significant downward contributions by the majority of the factors, with the largest negative contribution from European area delivery times,” the NY Fed said.
The gauge brings together 27 variables that take the temperature of everything from cross-border transportation costs to country-level manufacturing data in the euro area, China, Japan, South Korea, Taiwan, the UK and the US.


