Unlock the Editor’s Digest for free
Roula Khalaf, Editor of the FT, selects her favourite stories in this weekly newsletter.
This article is an on-site version of our Unhedged newsletter. Sign up here to get the newsletter sent straight to your inbox every weekday
Good morning. Dave Calhoun, Boeing’s chief executive, is stepping down. Unhedged’s view of Boeing is that it will never get investors back on side until it proves that the corporate culture has fundamentally changed. This looks like a step in that direction, but the shares didn’t react much. Still, we think Boeing is a more intriguing stock today than it was yesterday. Email us your view: robert.armstrong@ft.com and ethan.wu@ft.com.
What can go right on growth
US real gross domestic product appears to be growing at a nice, steady 2 per cent rate, right in line with the economy’s long-run growth potential. Risks linger: spreading pain among low-income consumers, commercial real estate distress hurting banks and deterioration in the labour market as above-trend immigration slows. Investors are primed to sweat these sorts of scenarios. Lately, though, there is an unusually high degree of optimism out there that growth will not just stay on trend, but could even accelerate. Here, then, is an incomplete list of what might go right for US growth (there is overlap between the bullets):
-
Co-operative inflation data creates a global rate-cutting cycle. Central banks are gaining confidence that rates can soon fall, and one, the Swiss National Bank, is already cutting. This could boost global growth, with implications for US exporters. Joseph Wang of the Fed Guy blog noted in a post yesterday that a global cutting cycle could also supercharge risk appetites. The biggest reason is that banks and investors hold global portfolios, so rising asset values “across their portfolios [could] have a greater easing impact than cuts in any single jurisdiction”. If so, a period of fast-loosening financial conditions, and accelerating growth, would probably follow.
-
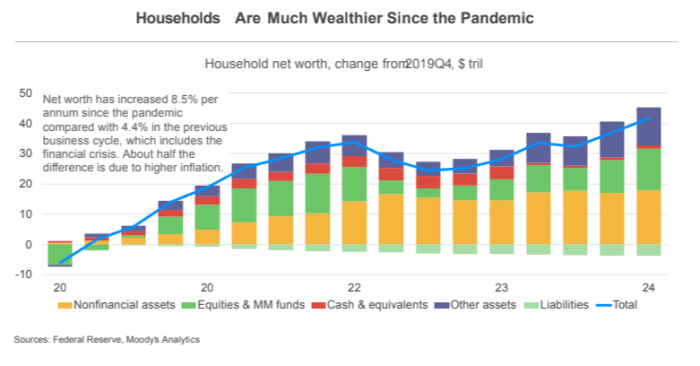
The “wealth effect” lifts spending. US stocks are up nearly 40 per cent in the past year or so and house prices are up 6 per cent. Research suggests the feeling of increasing wealth boosts actual consumer spending, as richer consumers save less and spend more out of their income. Mainstream estimates suggest that a $1 rise in wealth generates 3-5 cents of extra spending. And as the chart below from Moody’s Mark Zandi shows, wealth is broadly rising:
-
US productivity keeps improving. Better labour productivity would be the neatest path to higher growth, unlike, say, the wealth effect, which could unravel if stocks fall for some reason. Why would this happen? We like Adam Posen’s two-phase articulation, as laid out in his Unhedged interview last month. First, a tight labour market improves matching between employees and employers; well-matched workers do a better job, enabling both strong wage growth and margin expansion. Second, corporate investment in AI pays off, letting companies automate tedious processes and expand output.
-
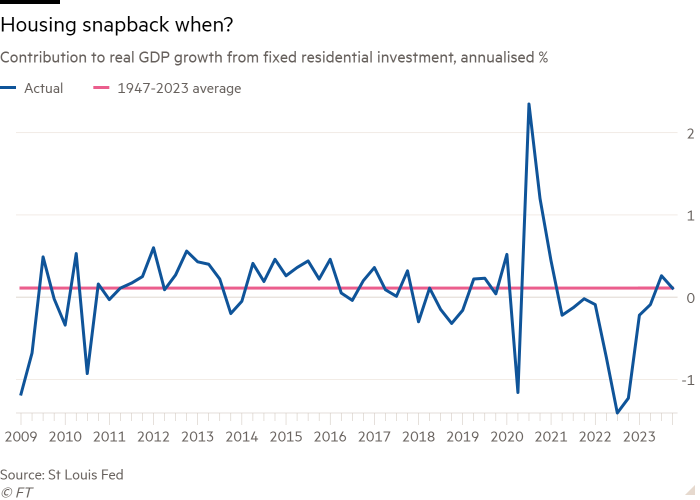
Lower mortgage rates create a big housing snapback. In the past three months, average 30-year mortgages rates have fallen from nearly 8 per cent to 6.9 per cent. Importantly, this has happened without any rate cuts, driven instead by lower rate volatility shrinking the mortgage rate spread over Treasuries. Already, there has been an uptick in new mortgage applications and pending home sales. If and when rates are cut, it could uncork the existing-home market, which has experienced depressed activity for two years. Housing investment’s contribution to growth has just recently reverted to its long-run average after a long period of dragging on growth (see chart below). Might the housing revival create a growth impulse?
-
Manufacturing finally emerges from its post-pandemic ennui. For nearly two years US manufacturing has undergone a protracted soft patch, dragged down by the great goods-to-services rotation. But recently, some manufacturing activity surveys are starting to tick up. The S&P PMI survey started this year with three back-to-back expansionary readings after spending much of 2023 in contraction territory. The ISM PMI manufacturing survey looks gloomier, but even there, the leading new orders index has firmed up a little. The backdrop is a more benign environment for manufacturing everywhere, with international freight activity rising and stable consumer demand across developed economies.
Of these, a revival in housing looks like the surest bet, only requiring you to believe that rate cuts will help as much as rises have already hurt. It would be a large, though temporary, cyclical growth boost. By contrast, rising productivity is perhaps the most durable secular story, but also the hardest to forecast. From the market’s point of view, though, one need not believe any particular scenario. The market is not an economic forecaster; it’s a sentiment amalgamator. That five plausible growth-upside stories exist appears to be enough, at least for now. (Ethan Wu)
The UK equity discount, redux
Yesterday I wrote about the UK equity discount and whether it really exists. The question is tricky because right now value stocks, non-US stocks and smaller stocks are out of favour, and UK stocks tend to be all three of those things. Is there an additional discount, on top of those, for the UK in particular? I can’t see why there would be, and comparing the basic numbers for well-known and cheap-looking UK stocks to those of rough American equivalents, the discounts look broadly justified. I just can’t find the great British bargain stock.
Edward Smith, co-chief investment officer at Rathbones Group, wrote to say that one of his colleagues, Oliver Jones, had done some statistical work on the topic, and found there was a unique UK discount. Jones found that UK stocks had a price/earnings ratio discount of about a third to US stocks and about half that much to the rest of Europe. But controlling for sector composition, exposure to the UK economy, and for fundamentals (growth, profitability and leverage) the discount only got a tiny bit smaller. Taking the Magnificent 7 US tech stocks out didn’t change things, either. His chart:
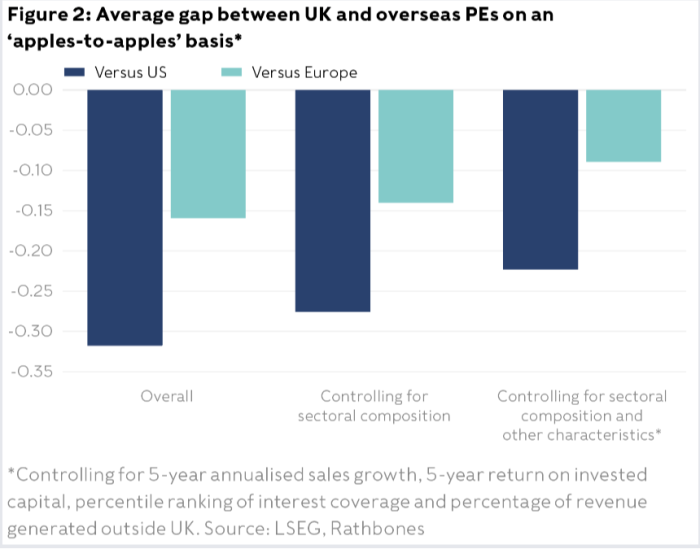
Why has the discount taken hold? Jones’s guess is that Brexit whacked investor confidence, a theory that explains the fact that the discount first appeared in 2016:
The Brexit vote triggered years of ensuing uncertainty about the UK’s relationship with the EU . . .
There are two reasons for optimism on this front . . . investors have downgraded UK equities in a broad-brush way which doesn’t reflect where any Brexit effects are most likely to fall. The fact that global firms listed in the UK trade at the same discount as domestic plays suggest that mispricing exists, which might plausibly correct in time. Second, there’s now far greater stability and political consensus around the broad parameters of the UK’s relationship with the EU.
This is just one regression analysis, and it could be wrong. But let’s assume it’s right. I still have the same problem: where my bargains at?
Lots of readers wrote in to say that UK tobacco companies and banks were at an unreasonable discount to their US brethren. I’m not seeing it in tobacco:

The difference in returns here is amazing, and there is a leverage difference, too. Give me Altria over British American Tobacco all day. For banks, the situation is (as always) more complex. Barclays and Citigroup are an interesting comparison. Both are big banks with significant card operations and second-tier investment banking businesses, and both are eternally about to turn the corner and be better. The basic numbers are similar, too. Barclays looks a bit cheaper to me; the only issue is that it is more leveraged, which muddies the return comparison:

What about more retail-focused banks? Lloyds and Wells Fargo make an interesting comparison, and again Lloyds is tempting. But not only is the leverage issue there, but Wells Fargo’s growth numbers reflect the fact that regulators have forbidden it to add assets in recent years:

The closet thing I have found to a legit bargain is in booze. Look at Diageo next to the American liquor group Brown-Forman. Diageo is notably cheaper, for broadly similar growth and returns that are not a million miles away, with only a bit more leverage:

This is interesting, especially given the greater breadth of the Diageo brand portfolio. And I don’t say this just because I put away my share of Guinness, Tanqueray and Bulleit Rye.
One good read
Lina Khan’s right-wing friends.
FT Unhedged podcast

Can’t get enough of Unhedged? Listen to our new podcast, hosted by Ethan Wu and Katie Martin, for a 15-minute dive into the latest markets news and financial headlines, twice a week. Catch up on past editions of the newsletter here.

