Dogecoin has exhibited an impressive performance this week, witnessing a substantial 42% rally. The meme cryptocurrency came close to breaking through the $0.182 resistance level, positioning it a stone’s throw away from the coveted $0.20 mark. The momentum of Dogecoin is evident as the live price has been hovering above the $0.188 mark,with a steady uptrend.
This surge in Dogecoin’s market activity has contributed to its market capitalization to $27.10 billion, securing it the 8th position on CoinMarketCap’s rankings. With a circulating supply of 143.63 billion DOGE coins, the currency demonstrates a high degree of market liquidity.
Dogecoin’s 1-Day Chart Signals Bullish,as $0.20 Looms
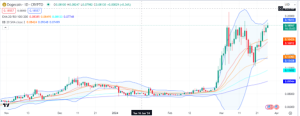
Dogecoin’s journey on the 1-day chart illustrates a significant bullish push, with the price recently flirting with the significant resistance level of $0.182. Dogecoin’s current price is $0.188684,recording a 4.47% increase in the last 24 hours.Dogecoin has recorded an impressive trading volume exceeding $3.31 billion,according to CoinMarketCap’s data.
The price trend of Dogecoin has been marked by substantial buyer interest, as indicated by the push towards and beyond the $0.182 threshold. This level now becomes a crucial pivot point for DOGE; sustaining above it may signal continued bullish momentum with potential targets nearing the $0.20 mark.
In the daily timeframe, Dogecoin (DOGE) is showing bullish signs within its technical indicators. The Exponential Moving Averages (EMAs) display a bullish configuration, with the price hovering above the 20, 50, 100, and 200-day EMAs — a strong indication of an ongoing uptrend.
Notably, the 20-day EMA has served as dynamic support, reinforcing the bullish sentiment each time the price dipped to test this line.
The Bollinger Bands (BB) further suggest a volatility increase, as the bands are beginning to widen. The current price is near the upper band, implying potential resistance or a stretch into overbought territory. Traders typically watch for consolidation or a mild pullback after such a touch.
At the same time, the price chart forms higher lows and higher highs, a fundamental characteristic of a healthy uptrend. With the most recent candlestick closing near the day’s high, it indicates that buyers are not giving up control easily, even as prices reach higher levels.
DOGE Gathers Bullish Steam: A Turnaround in Sight as Robinhood Sees Major Transfers
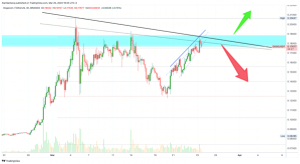
Dogecoin’s market trajectory has captured the attention of traders like Alan Santana, who closely watches the daily session closes for signs of strength. A solid close above the trendline, despite representing a lower high than the early March peak, may tilt the scales in favor of the bulls. This could lay the groundwork for further gains in the upcoming weeks, although the need for sustained momentum and confirmation remains crucial.
Santana has highlighted that Dogecoin’s recent chart forms a lower high when scrutinized against early March levels. Such a pattern usually denotes a bearish trend persisting, calling for a measured approach to the current market optimism.
This cautious stance is set against a backdrop of significant activity within Dogecoin’s ecosystem. A recent report from Whale Alert has shone a light on a notable shuffle of Dogecoin funds, with substantial amounts moving in and out of Robinhood. A whopping 1.87 billion DOGE has been transacted in a single day, hinting at the intensifying dynamics of Dogecoin’s position in the market.
Whale Alert’s data reveals that anonymous entities have executed massive withdrawals from Robinhood, involving quantities up to 250 million DOGE.
Almost half of the total volume transacted was pulled from the platform, only to see a similar magnitude returning to it later. These vast movements signify the active whale actions that contribute to the liquidity and volatility of Dogecoin’s market.


